
Sanitation
Sanitation
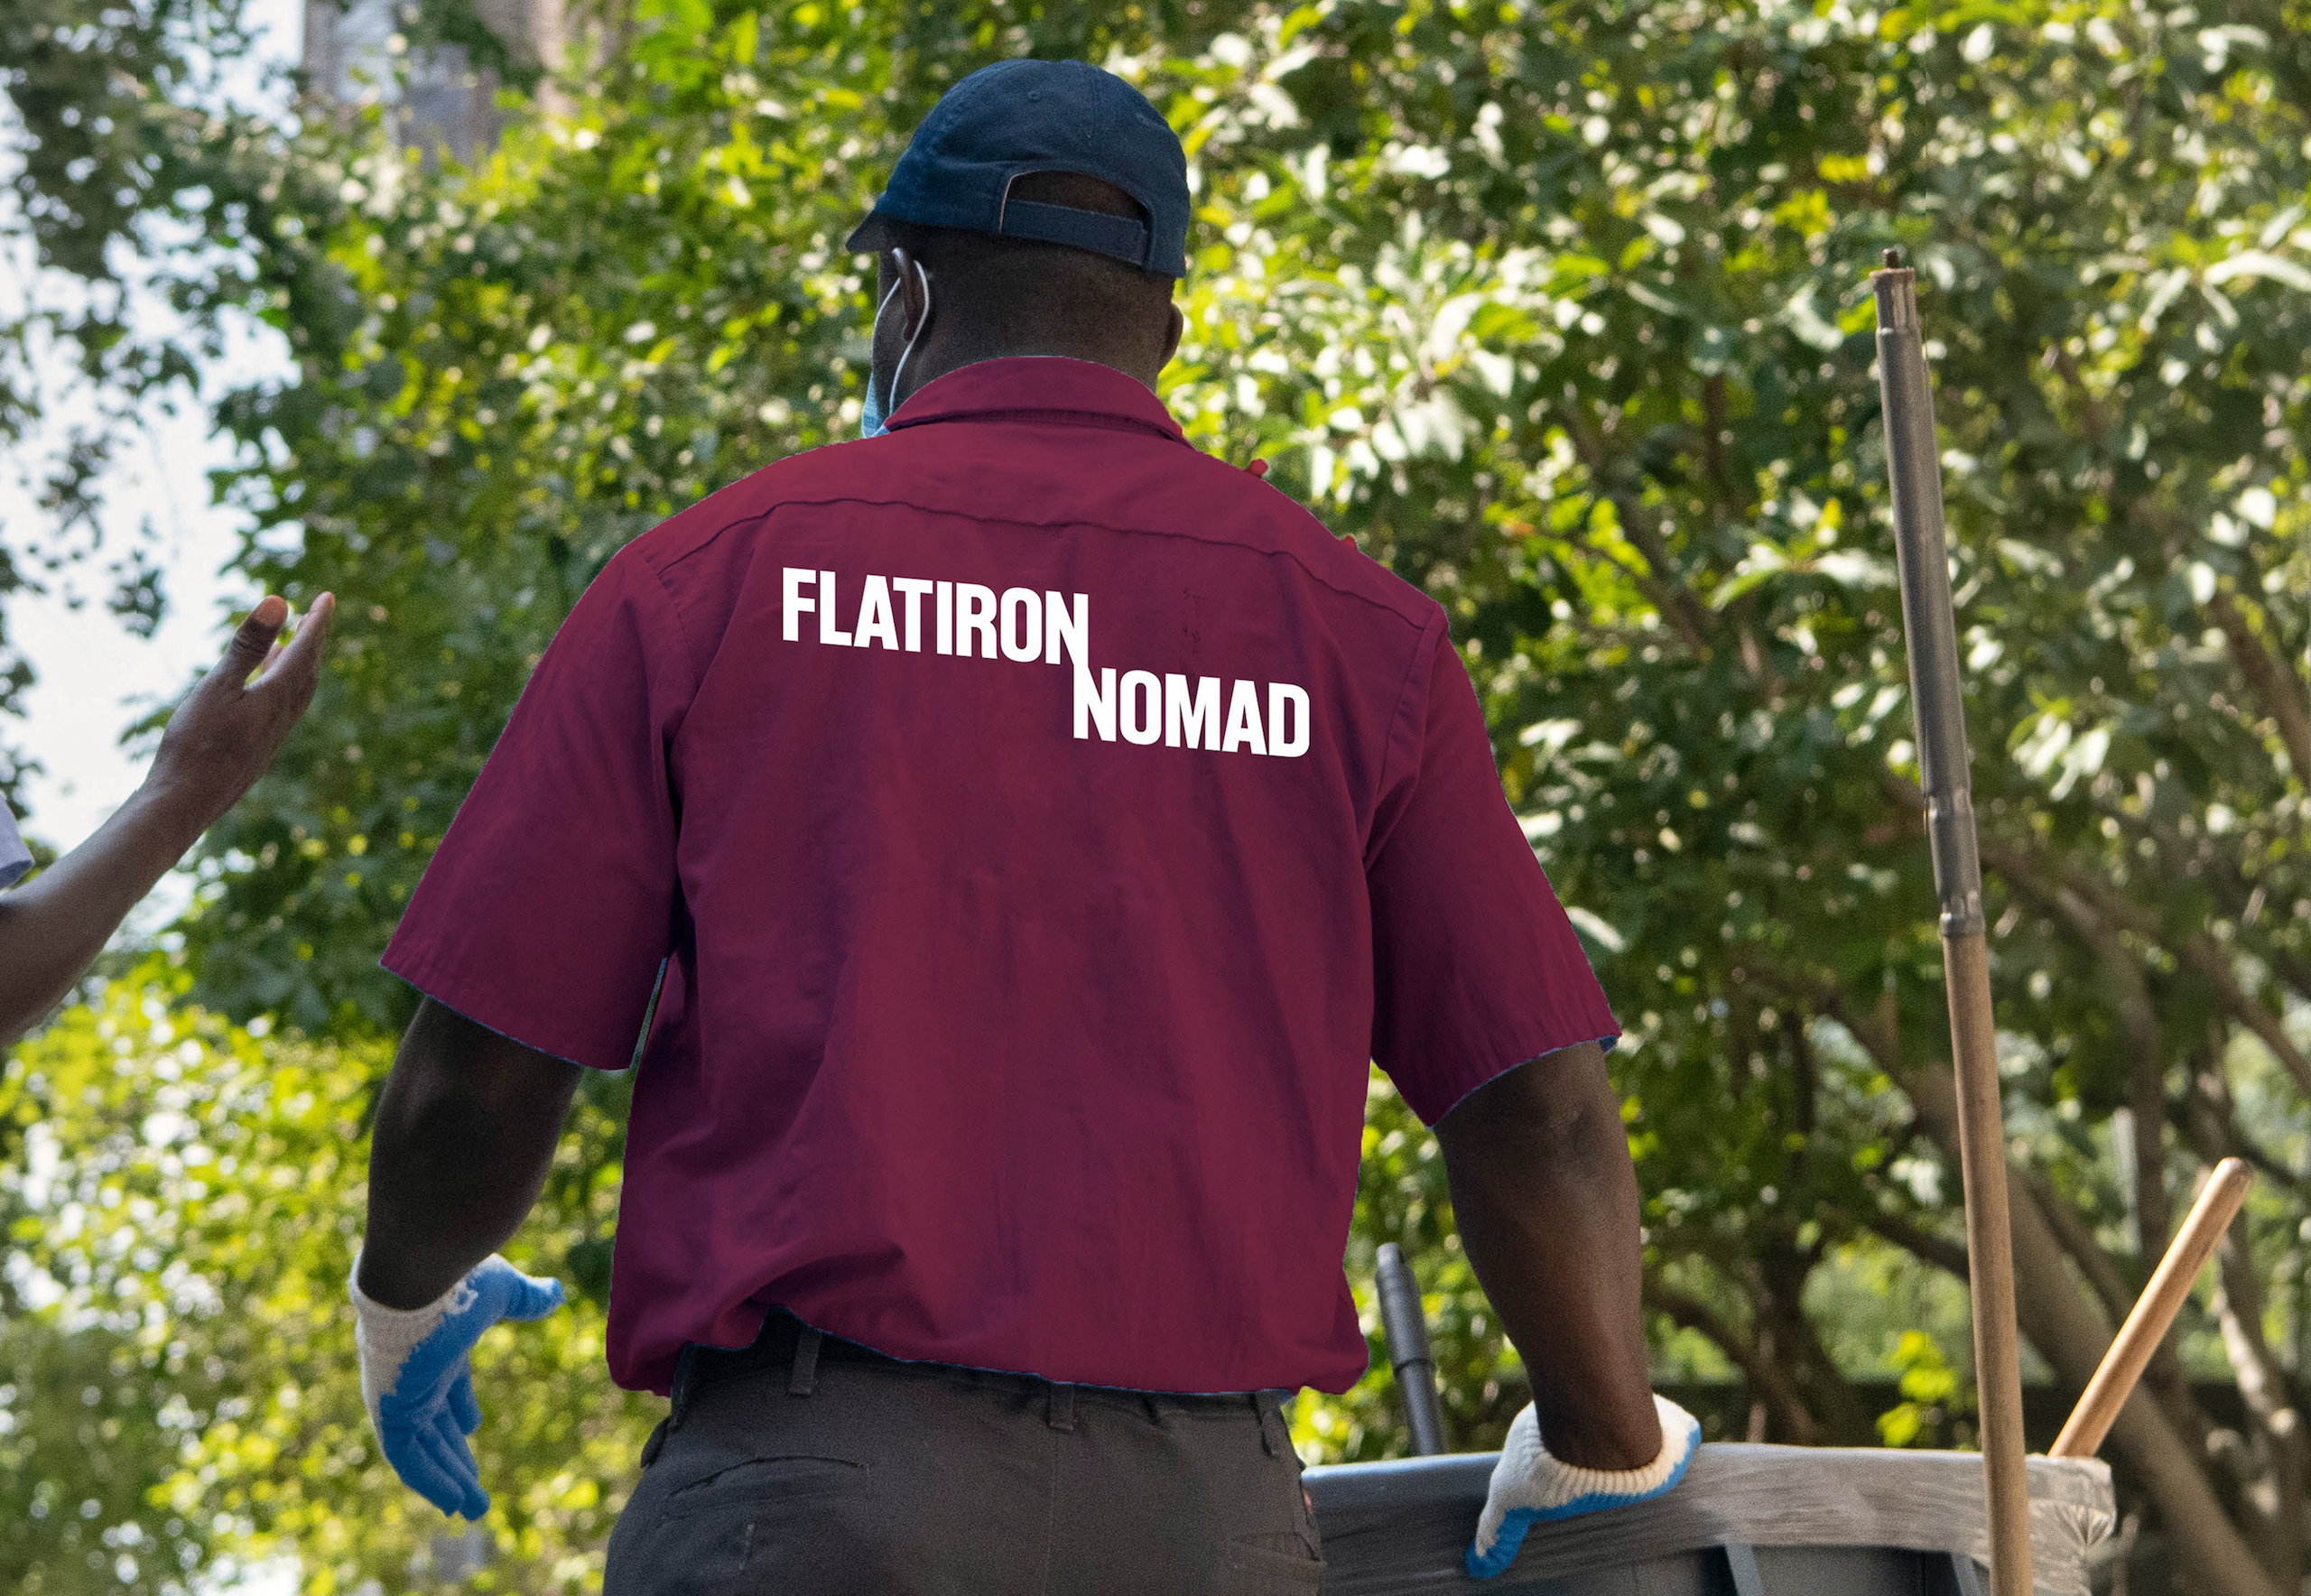
Clean streets, sidewalks, plazas, and public amenities are foundational to our thriving district. Our Clean Team—armed with brooms, litter bags, shovels, and determination—keeps these spaces inviting to the tens of thousands of residents, commuters, and visitors who enjoy them every day. Seven days a week, in all weather, the team works tirelessly to remove graffiti, sweep sidewalks, shovel snow, and power-wash heavily trafficked areas. The team also maintains our 280-plus trash bins and cleans and paints bus stops, fire hydrants, mailboxes, WiFi kiosks, and other City assets.
Sanitation was our first core service when the Partnership was founded in 2006—and it’s still our largest. As our footprint has grown, the Clean Team has stepped up, servicing the Flatiron Public Plazas since 2008 and nearly doubling its reach when the BID expanded in 2022.
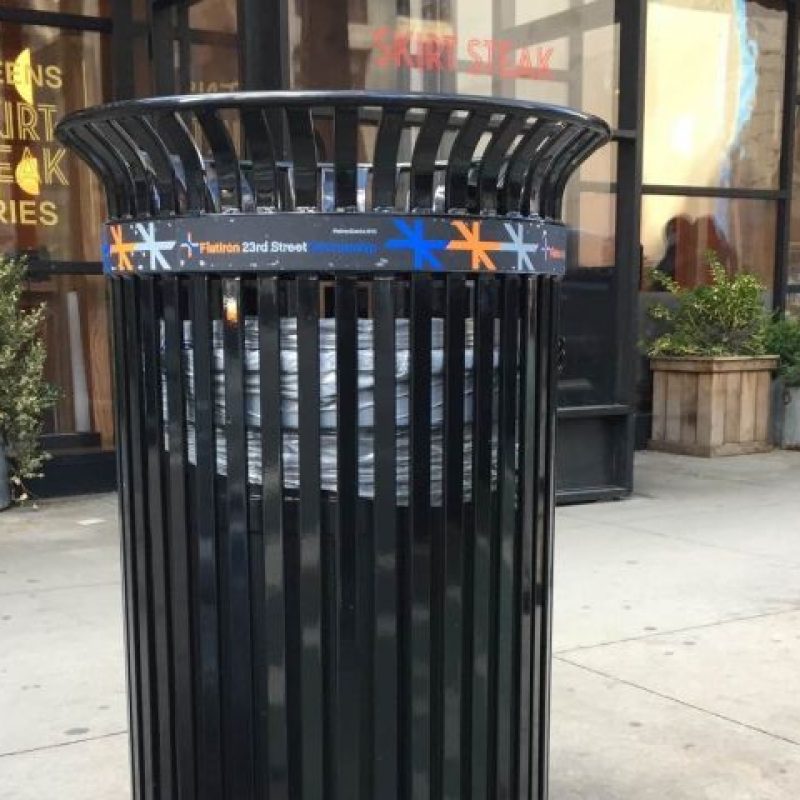
We welcome local businesses and organizations to sponsor our distinctive trash bins, located throughout the district. To learn more, see our sponsorship catalog.